Tag Archives: butterfly effect

Happy 50th Anniversary, Chaos

This month, the American Physics Society magazine, Physics Today, published an article about the 50th anniversary of the Lorenz model. At the link, you can read the entire article. In it, experts describe the history of chaos, Lorenz’s discovery of it, and some of the state of the field today, but with a great deal less technical jargon.

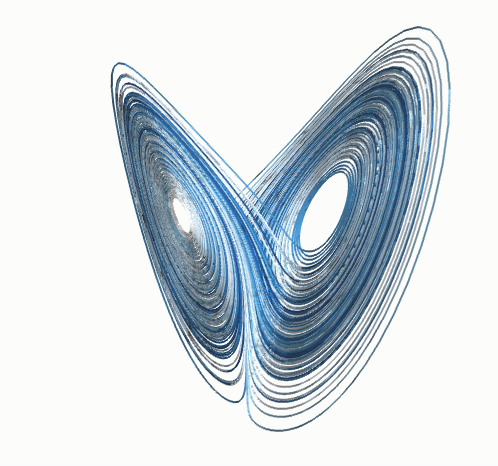
50 years ago, Edward Lorenz first captured the mathematical phenomena we now know as chaos, known popularly as the “butterfly effect“. Below is a picture from the Lorenz model exhibiting chaos. The idea of chaos boils down to highly structured behavior that cannot be predicted. No matter how precisely we measure, after some time we cannot know the state of the system. We can say that the system will stay in a certain region of weather; in the picture below, there are definitely places the trajectory does not visit. We observe this with weather models– the forecast is good for a couple of days, so-so for a couple of days after that, and completely inaccurate for any time farther in the future. Analogously, we can say that it will not be -100 C tomorrow. Appropriately, Lorenz’s discovery of chaos came about as he tried to develop a model for the weather. Chaos is all around us and can be observed in a number of systems.

the Lorenz system, which turned 50 this year

At this link, you can play with a fun Lorenz model java applet. The trick with the applet is choosing the right parameters. Try setting the “spread” to 0.1, the “variation” to 20, the “number of series” to 2, and the “refresh period” to 100. Then push the button “reset the parameters” and “restart”. This will start 2 trajectories in the Lorenz model that differ by only 0.1. You will quickly see the two paths diverge and become completely unrelated. If you reduce the “spread” to 0.01, the same thing will happen, though it will take longer. As long as the spread is more than 0, the two paths will eventually diverge.

This is why we cannot predict the state of a chaotic system, because our ability to measure the state of the system is inevitably flawed. If we could measure the state of the weather to 99.99999% accuracy, that 0.00001% inaccuracy would eventually lead to divergence. And you can imagine that getting 99.99999% accuracy is much harder and more expensive than 99.9% accuracy.

Did you know that Pluto’s orbit is chaotic? Or a double pendulum? Or the logistic model for population dynamics? So check out the Lorenz model, and happy chaos-ing.

Advertisement

Fun Science: Chaos

The common concept of chaos as the disordered unknown is a concept thousands of years old. Chaos as a branch of mathematics refers to an extremely ordered but complex behavior. In some lights, mathematical chaos might seem utterly random; different inspections reveal order. The first model of chaos emerged in the 1950s to model the movement of air in the atmosphere– the Lorenz model.

Defining Chaos in Mathematics

First, let’s discuss what chaos is in a mathematical sense (chaos on scholarpedia). In daily language, we would assume that something chaotic is not at all predictable. Chaos is deterministic, which means that if we know the position or value of a chaotic element exactly, then we know every value that it will ever have for all times. Many non chaotic systems are deterministic also; if we measure the position and velocity of a pendulum and its frictional loss, we can predict its path for all time.

If we are measuring some value, there is a limit to our possible accuracy. If you measure your weight, you are measuring your weight plus or minus some error associated with the instrument. We know some scales are more accurate, and some are less accurate. When we measure the position and velocity of the pendulum, there is some error, but the behavior at position x plus a little bit (or x+ε) is essentially identical to the behavior at position x. In a chaotic system, the paths following positions x+ε and x will be entirely different after some window of time. The paths will be similar for some window of time; the length of this window is determined by how chaotic the system is. This behavior is known as sensitive dependence upon initial conditions (or more famously, the butterfly effect).

The lower half of the image below shows the difference between two paths starting at x+ε and x in the Lorenz attractor. The paths are nearly the same, until they quickly become very different. You can look at the Lorenz attractor in more detail and play with it here. The link goes to a Java applet hosted by Caltech where you can change the parameters and see what happens in a time series and in a different representation called the state space.

The above image also shows the third of the three most common criteria for chaos: periodicity. This means that the system oscillates in some kind of way. The top half the picture above shows the time series of z variable (see link above for the full model if you are interested). If we plot the data in a different way, we get the image below. This image is called the Lorenz attractor. We see it loops around, but that it is bounded in space. That is, there are places we can say the path will not go. Intriguingly, the Lorenz attractor has a fractal dimension of 2.06. For more on fractals, you can read my posts on fractals and fractal dimensions.

Simple example of chaos: the double pendulum

Many pretty simple systems can exhibit chaos. The easiest example is the double pendulum, which is just a pendulum whose bottom is the top for a second pendulum.  The video below shows the complexity of behavior achieved by the double pendulum. Chaos has also been demonstrated in electrical circuits, biological systems, electrochemical reactions and planetary orbits. In another post, I will write about the amazingly universality of chaos, which shows how all of the diverse systems I listed are in fact very similar.