In materials science class, we examined wallpaper patterns for symmetries. Atoms and molecules can pack according to a variety of crystal structures. Mathematics obviously loves patterns too. There are fractal tilings and tessellations. Who doesn’t love Escher? There are probably practical applications to tiling, but more importantly they are great fun that tickles the brain. Recently I took my first stab at pattern making depicting (what else?) water polo.
Tag Archives: mathematics

Turing Patterns: What do a leopard’s spots, vegetation in arid zones, and the formation of fingers have in common?
Please excuse my inconsistent posting of late, I have been deep down the rabbit hole of science. Last week, I attended the Society of Industrial and Applied Math (SIAM) dynamical systems conference. What fun!
I learned about Turing Patterns, named for mathematician Alan Turing. Complex patterns can arise from the balance between the diffusion of chemicals and the reaction of those chemicals. For this reason, Turing’s model is also called the Reaction-Diffusion model. In general, these kinds of patterns can arise when there’s some kind of competition.
This sounds abstract, but suspected examples in nature abound. Have you ever wondered how the leopard got his spots or what’s behind the patterns on seashells? We often don’t know the chemical mechanisms that produce the patterns, but we can mathematically reproduce them with generic models.

Image from wired.com discussion of Turing patterns.
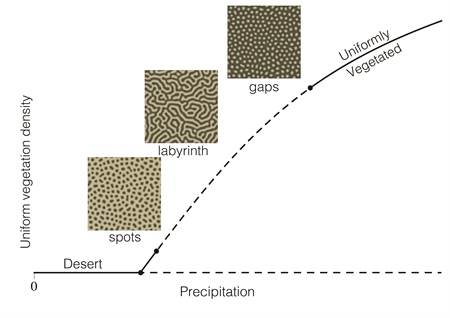
Mary Silber and her grad student Karna Gowda presented research on Turing patterns in the vegetation of arid regions. When there isn’t enough precipitation to support uniform vegetation, what vegetation will you observe? If there’s too little water, their model yields a vegetation-free desert. Between “not enough” and “plenty” the model generates patterns, from spots to labyrinths to gaps. Their work expands at least two decades worth of study of Turing patterns in vegetation.

Figure by Karna Gowda, see the full article at SIAM news.
Silber and Gowda considered an area in the Horn of Africa (the bit that juts east below the Middle East). Here, stable patterns in the vegetation have been documented since the 1950s. They wanted to know how the patterns have changed with time. Have the wavelengths between vegetation bands changed? Are there signs of distress due to climate change? By comparing pictures taken by the RAF in the 1950s to recent satellite images, they found that the pattern were remarkably stable. The bands slowly travelled uphill, but they had the same wavelength and the same pattern. They only observed damage in areas with lots of new roads.

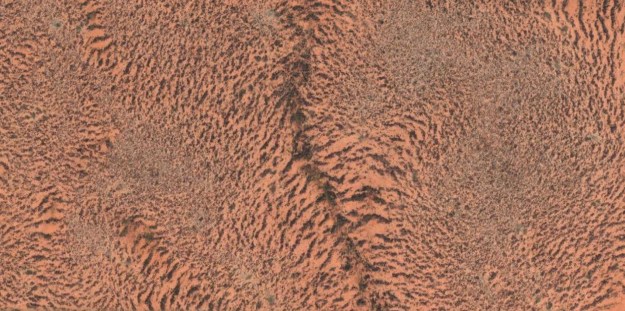
From google maps of the Horn of Africa! I screen-capped this from here.
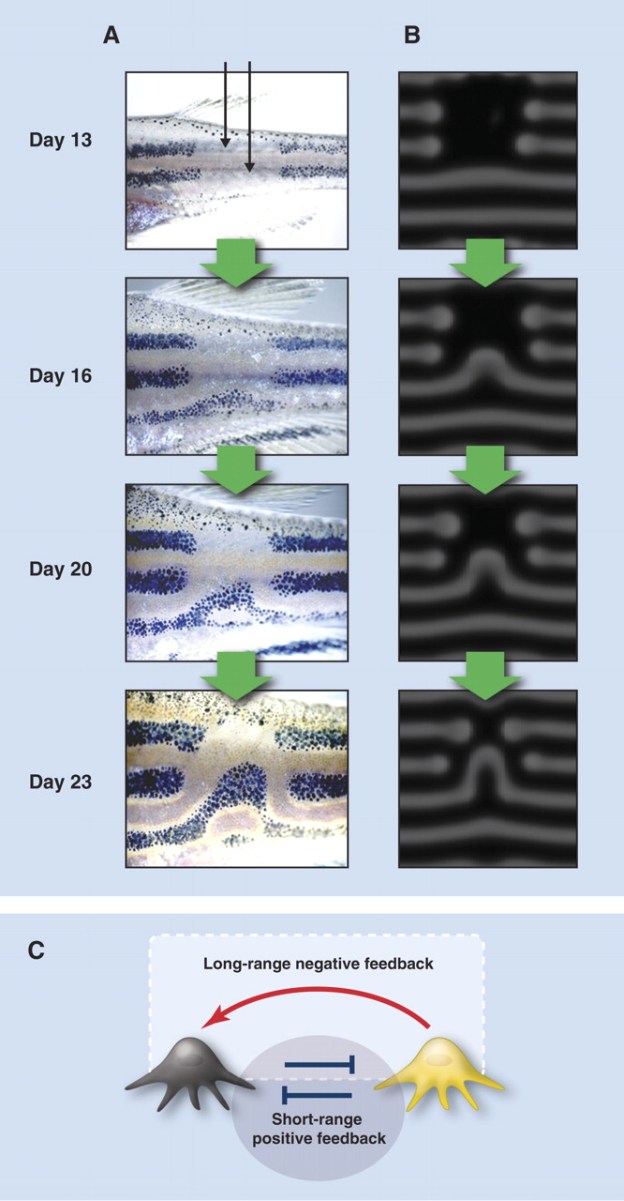
Turing patterns have even been studied experimentally in zebrafish. Zebrafish stripes might appear stationary, but they will slowly change in response to perturbations. So scientists did just. Below is a figure from the paper. The left shows the pattern on the zebrafish, the right shows the predictions of the model.

Experimental perturbations to the patterns of zebrafish are well-predicted by the Turing model. Read more in this excellent Science paper.
The model has been used to explain the distribution of feather buds in chicks and hair follicles in mice. Turing’s equations have even been used to explain how fingers form.
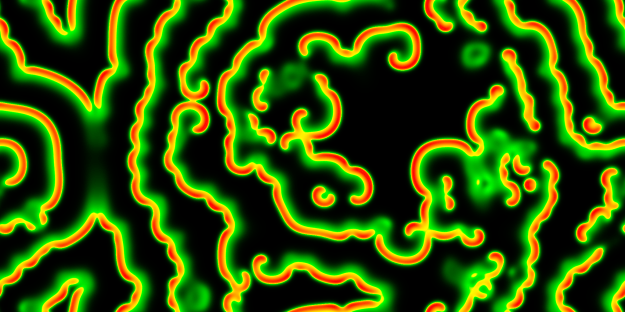
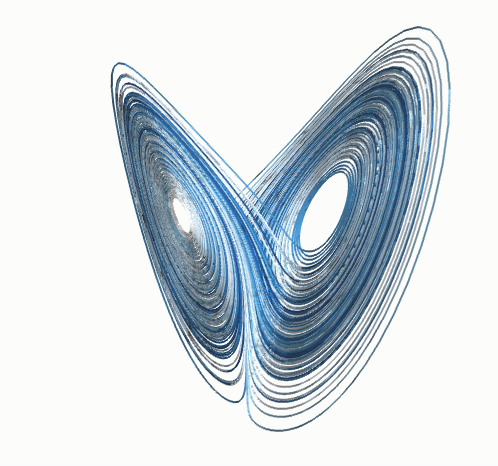
If you want to learn more, the links above are a great start. And if you want to play with the patterns yourself, check out this super fun interactive. These waves aren’t stationary like the Turing patterns I described here, but they arise from similar mathematics. The interactive can make your computer work, fyi.

Reaction-diffusion pattern I generated with this online interactive. It’s super fun!

Fractal Art
Here in Albuquerque, mathematical art adorns the schools. We are the Fractal Capital of the World. Fractals are a kind of math that considers the multi-scale aspects of nature. In school, we learn about rectangles, circles, and triangles, but which of these shapes best represents the coastline of Great Britain?
And even if learning fractal math isn’t your path, you probably appreciate what others have done with it. This documentary describes how lava in Star Wars was simulated using fractal approaches. Many natural objects have fractal aspects, and CGI versions of these objects utilize this approach.
I do research in nonlinear dynamics, which is a cousin to chaos theory and fractal math. Fractal math first emerged as a visual wonder with Benoit Mandelbrot; as a scientist and artist, fractals inspire me in multiple ways. I hope my forays into fractals might inspire, too!
Fun science: An easy fractal to make at home
Viscous fingering is a fractal pattern that occurs when a less viscous (or thick) fluid spreads through a more viscous (or thick) fluid. Such systems are present in oil extraction, when we pump one fluid underground to push another one out. Fractals are common in nature even though they’re new to our mathematics, and they are beautiful.
The pictures in this post were created with basic watercolor paints using one simple principle: water containing paint is more viscous than regular water. It’s easy to try at home!
For the top picture, I laid down red paint. Before the paint dried, I added salt, then let the square dry. Water from the still-damp paper rushed to the salt (because of entropy, systems tend towards uniform distributions of things if they can help it– in this case, the lowest energy state is to have a uniform distribution of salt). But because paint molecules are larger than water molecules, they don’t move as well. The water that accumulates around the salt has less paint than the water in the rest of the paper, and thus we have a less viscous fluid spreading into a more viscous one. Try it at home! If the paint is too wet or too dry when you add the salt, the results won’t be as dramatic, so play around a bit. Larger salt crystals can be especially fun.
For the three pictures below, I simply placed a drop of water into a damp square of paint. The patterns vary depending upon the size of my drop, the wetness of the paint, and the paint color (the chemistry of which influences the viscosity of the paint).
Below are a couple of examples from the University of Alberta of viscous fingering with pentane into oil and water into oil. This particular research aims to improve the flow rate of oil during extraction. And it looks pretty similar to some humble watercolors.
Left: pentane displacing mineral oil. Right: Water displacing mineral oil (University of Alberta).
Happy 50th Anniversary, Chaos
This month, the American Physics Society magazine, Physics Today, published an article about the 50th anniversary of the Lorenz model. At the link, you can read the entire article. In it, experts describe the history of chaos, Lorenz’s discovery of it, and some of the state of the field today, but with a great deal less technical jargon.
50 years ago, Edward Lorenz first captured the mathematical phenomena we now know as chaos, known popularly as the “butterfly effect“. Below is a picture from the Lorenz model exhibiting chaos. The idea of chaos boils down to highly structured behavior that cannot be predicted. No matter how precisely we measure, after some time we cannot know the state of the system. We can say that the system will stay in a certain region of weather; in the picture below, there are definitely places the trajectory does not visit. We observe this with weather models– the forecast is good for a couple of days, so-so for a couple of days after that, and completely inaccurate for any time farther in the future. Analogously, we can say that it will not be -100 C tomorrow. Appropriately, Lorenz’s discovery of chaos came about as he tried to develop a model for the weather. Chaos is all around us and can be observed in a number of systems.
At this link, you can play with a fun Lorenz model java applet. The trick with the applet is choosing the right parameters. Try setting the “spread” to 0.1, the “variation” to 20, the “number of series” to 2, and the “refresh period” to 100. Then push the button “reset the parameters” and “restart”. This will start 2 trajectories in the Lorenz model that differ by only 0.1. You will quickly see the two paths diverge and become completely unrelated. If you reduce the “spread” to 0.01, the same thing will happen, though it will take longer. As long as the spread is more than 0, the two paths will eventually diverge.
This is why we cannot predict the state of a chaotic system, because our ability to measure the state of the system is inevitably flawed. If we could measure the state of the weather to 99.99999% accuracy, that 0.00001% inaccuracy would eventually lead to divergence. And you can imagine that getting 99.99999% accuracy is much harder and more expensive than 99.9% accuracy.
Did you know that Pluto’s orbit is chaotic? Or a double pendulum? Or the logistic model for population dynamics? So check out the Lorenz model, and happy chaos-ing.
Fun Science: Small World Networks
The small-world phenomenon refers to the fact that even in a very large population, it takes relatively few connections to go from any element 1 to another random element. Amongst people, we know this concept as the “six degrees of separation” game. Any population of objects with connections can be conceptualized this way. Examples include crickets communicating by audible chirps, websites with links, electrical elements with wiring, board members with common members, or authors on mutual scientific papers. All of the examples I list have been examined in various scientific studies.
In a small-world network, elements are first connected in a regular lattice; for example, each element is connected to one or two nearby neighbors on each side. The leftmost picture below shows a regular lattice of elements. A connection between element i and element j is then removed. Then we add a connection between element i and any other element x, like the middle picture below. If x is across the network from i, then the number of steps between i and x has been reduced from some large number to 1. All of the elements connected to i are now 2 steps from element x. This reduces the diameter of the network, which is the maximum number of steps between any two elements, although the number of connections remains constant. In the six-degrees of separation game, the diameter would be 6. As we replace more of the lattice connections with random ones, the network becomes more and more random. We quantify a small-world network by its randomness, as in the picture below.
The small-world network has been explored as a means of sending information efficiently through a population. As the diameter reduces, the time it takes information to spread through the entire network reduces. Neurons in the brain have been explored as small-world networks; certain regions of the brain are highly interconnected with a few long distance connections to other regions of the brain. Protein networks and gene transcription networks have also been described with the small-world model. Further information with scholarly references is available on the scholarpedia page (which is generally a great resource for complex systems problems).
Here you can read a good scientific paper by Steven Strogatz, one of the premier scientists in the area. This is a paper published in Nature, one of the highest scientific publications. There are some equations, but the figures are also excellent if you are uncomfortable with the math. The paper models the power grid, boards of directors, and coauthorship using network ideas. I mention this paper specifically because I find Strogatz a very relatable and clear writer. Also consider reading his recent nontechnical book about math, The Joy of X, for more math fun.
Check out my other science posts on graph theory, chaos, fractals, the mandelbrot set, and synchrony. And drop a note with any questions!
Fun Science: Network Theory and Graphs
If you have a set of items and you can connect or sequence them in many ways, you probably have a graph or network. Clearly if you have these objects, some connection arrangements might be preferable to others. Heart cells are connected in patterns that contract the heart in the proper pattern. If you must deliver items to ten different locations, different paths may be more efficient (the traveling salesman problem).
Euler’s 1735 Koenigsberg bridge problem is considered the first graph theory problem. At the time, the city of Koenigsberg had seven bridges (shown above). Euler wished to find a path which crossed each bridge exactly once. He showed mathematically that no path satisfied those constraints.
The famous game “six degrees of Kevin Bacon” is a network theory problem. This game says that with six steps, any actor can be linked to Kevin Bacon through films pairs of actors appeared in. This idea was originally introduced at the Erdös number. Paul Erdös was a brilliant and highly published mathematician (over 1500 papers!) who worked in graph theory and combinatorics. The Erdös number was how many papers it took by coauthoring to connect you to Erdös. He was also wonderfully eccentric. Once, visiting a friend, he woke in the night to get some juice. In the morning, his friend found red liquid all over the floor. Erdös, puzzled by the juice carton, had simply stabbed a hole in the side to drink from. His biography is a fascinating glimpse into a nearly alien mind.
In my own research, I look at how oscillators synchronize in small networks, such as rings. Even in a simple ring, many new types of synchrony occur, compared to all-to-all connections. It is easy to believe that the structure of the brain, and how various regions and subregions connect, might greatly influence human thinking. On a more science fiction note, I suspect that artificial intelligence will not exist in machines without complex networks of elements.
This was just a very quick overview of a huge field. In the future, I plan to write on topics like small-world networks, scale-free networks, and synchrony on networks. Check out my other science posts on synchrony, fractals, the Mandelbrot set, and chaos.