Tag Archives: fractals

Fractal Art

Here in Albuquerque, mathematical art adorns the schools. We are the Fractal Capital of the World. Fractals are a kind of math that considers the multi-scale aspects of nature. In school, we learn about rectangles, circles, and triangles, but which of these shapes best represents the coastline of Great Britain?

And even if learning fractal math isn’t your path, you probably appreciate what others have done with it.  This documentary describes how lava in Star Wars was simulated using fractal approaches. Many natural objects have fractal aspects, and CGI versions of these objects utilize this approach.

I do research in nonlinear dynamics, which is a cousin to chaos theory and fractal math. Fractal math first emerged as a visual wonder with Benoit Mandelbrot; as a scientist and artist, fractals inspire me in multiple ways. I hope my forays into fractals might inspire, too!

This slideshow requires JavaScript.

Fun science: An easy fractal to make at home

DSC00224

Viscous fingering is a fractal pattern that occurs when a less viscous (or thick) fluid spreads through a more viscous (or thick) fluid. Such systems are present in oil extraction, when we pump one fluid underground to push another one out. Fractals are common in nature even though they’re new to our mathematics, and they are beautiful.

The pictures in this post were created with basic watercolor paints using one simple principle: water containing paint is more viscous than regular water. It’s easy to try at home!

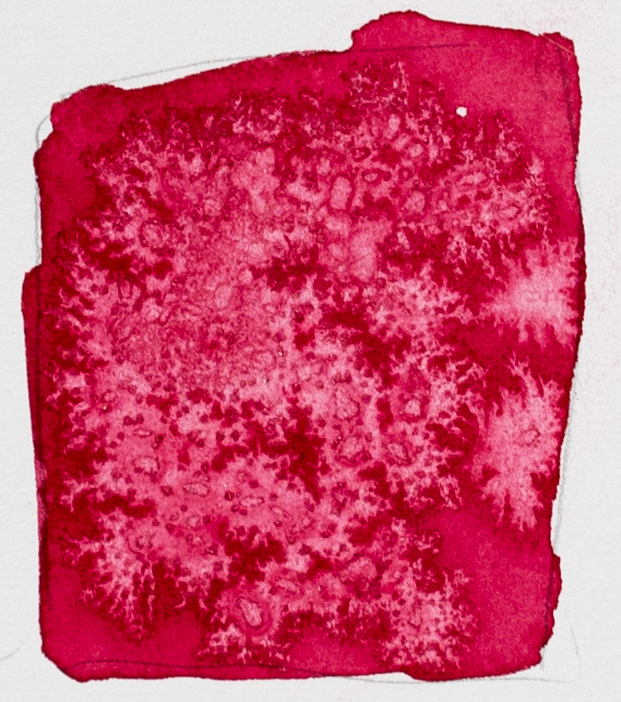
For the top picture, I laid down red paint. Before the paint dried, I added salt, then let the square dry. Water from the still-damp paper rushed to the salt (because of entropy, systems tend towards uniform distributions of things if they can help it– in this case, the lowest energy state is to have a uniform distribution of salt). But because paint molecules are larger than water molecules, they don’t move as well. The water that accumulates around the salt has less paint than the water in the rest of the paper, and thus we have a less viscous fluid spreading into a more viscous one. Try it at home! If the paint is too wet or too dry when you add the salt, the results won’t be as dramatic, so play around a bit. Larger salt crystals can be especially fun.

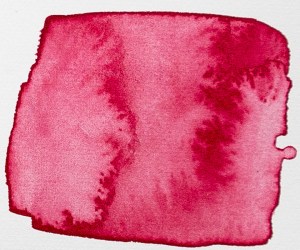
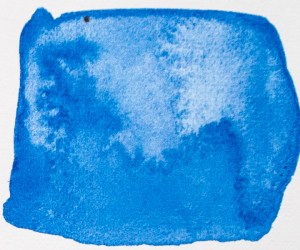
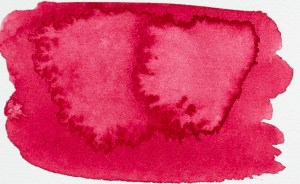
For the three pictures below, I simply placed a drop of water into a damp square of paint. The patterns vary depending upon the size of my drop, the wetness of the paint, and the paint color (the chemistry of which influences the viscosity of the paint).

DSC00225-2 DSC00225-3 DSC00225


Below are a couple of examples from the University of Alberta of viscous fingering with pentane into oil and water into oil. This particular research aims to improve the flow rate of oil during extraction. And it looks pretty similar to some humble watercolors.

Left: pentane displacing mineral oil. Right: Water displacing mineral oil (University of Alberta).

Fun science: scale-free networks

A scale-free network is a network with self-similar structure. As you zoom in on parts of the network, the sub-network resembles the overall network. In this way, scale-free networks are the network analogy of fractals. (Read previous posts about fractals, or fractals in nature.) Fractals arise in many natural systems like coastlines, snowflakes, and topology; likewise many naturally arising networks are self-similar. Examples include links on the internet, social networks, and protein interaction networks. Understanding the structure of a network helps us to understand the types of behavior that can occur on the network. Some network structures are more prone to failure or instability, or different types of failure or instability.

Scale-free networks have a sort of hub arrangement. Some elements connect to a bunch of other elements, while most connect to just a few. Going back to the social network analogy, the hubs are those people with 1500 friends on Facebook, while most people have 100 or so. In the picture below, a random network is shown on the left, and a scale-free network is shown on the right (hubs shown in grey). In the random network, all the elements have roughly the same number of connections, with some slightly more, some slightly less. The scale-free there has more variation in number of connections amongst elements.

From Wikipedia page on scale-free networks.

Getting more mathematical, the number of connections an element has gives its degree. An element with 3 connections has a degree of 3. We can say, hypothetically, that element 1 has a degree of 2, element 2 has a degree of 6, element 3 has a degree of 2, etc. We have degrees for all of the elements of the network. If we organize this set of degrees into a histogram (where we bin by degree value– in our example, we had counted two of degree 2, and one of degree 6) we get a degree distribution.

If something is distributed normally, the histogram has a bell-shape to it, like the first picture below. If you did a histogram of the height of all the people in your city, it would be a normal distribution. If it is distributed in a scale-free fashion, there are a few high value elements (high degree in our case), and a lot of low value elements. This gives the bottom picture, with a peak at a low value and a long tail into the higher values. The wealth distribution in your city probably looks like the scale-free distribution. If you take the log of the values on the scale-free distribution, you will get a straight line. This is because the logarithm is the inverse of the function 10^x; if you take the log of something, you can see its behavior on the 10^x scale, which gives you insight into how it behaves across multiple powers of 10, or its “scaling free” behavior.

From Wikipedia article on normal distribution

From Wikipedia article on power-law distribution

If you are interested in other basic explanations of more advanced science, also check out my posts on synchrony, chaosnetwork theory, and small-world networks.

Fractals in Life: photos

Fractals are a branch of math that better describes nature. Before fractals, there was Euclidean geometry, the geometry of lines, planes, and spaces. Euclidean geometry cannot give the length of a rough coastline; neither can it give the surface area of shaggy tree bark. The answer you arrive at in Euclidean geometry depends upon the scale at which you examine an object– intuitively the distance an ant travels over rough terrain is different from the distance we cover walking. The ant interacts with the terrain at a different length scale than we do. Fractal geometry is designed to handle objects with multiple meaningful length scales.

Fractal objects are sometimes called “scale-free“. This means that the object looks roughly the same even if examined at very different zooms. Many natural objects look similar at multiple zooms. Below, I include a few. The craters on the moon are scale-free. If you keep zooming in, you could not tell the scale of the image.

frac (1)

Terrain is often scale-free in appearance– a few years ago there was a joke photo with a penny for scale. The owners of the photo subsequently revealed that the “penny” was actually 3 feet across. I couldn’t find the photo, but you cannot tell the difference. The reveal was startling. Below is a picture of Mount St Helens. The top of this mountain is five miles (3.2ish km) away. Streams carry silt away from the mountain, as you can see more towards the foreground. They look like tiny streams. These are full-sized rivers. Mount St. Helens lacks much of the vegetation and features we would usually use to determine scale. The result is amazingly disorienting, and demonstrates scale invariance.

SONY DSC

Plants are often scale free too. Small branches are very similar in appearance to large branches. Ferns look very fractal. Below is a picture of Huperzia phlegmaria. Each time this plant branches, there are exactly two branches. Along its length, it branches many times. It is a physical realization of a binary tree.

SONY DSC

For more about fractals, read my posts about fractal measurement and the mandelbrot set.

Fun Science: Fractals and the Mandelbrot Set

Fractals are often immediately visually appealing, even if the underlying equation is harder to understand. For this reason, fractals have reached a wider audience than many branches of mathematics. Beyond their visual appeal, fractals give us a way to look at many natural systems that math was not previously able to examine. How long is a winding and convoluted coastline? How does a one-dimensional system like the circulatory system serve our three-dimensional bodies? How does lightning disburse its energy when it strikes? (The image below shows how electricity dissipated through a block of plexiglass, more details here.) These are all concepts related to fractals.

from Capturedlightning.com

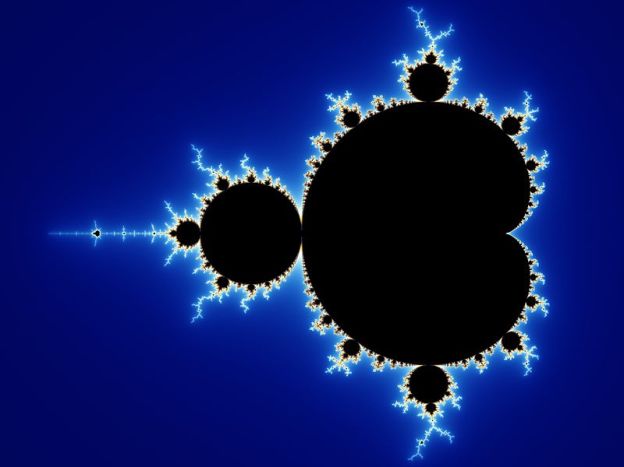
One very famous fractal is the Mandelbrot set (pictured at the top of this entry), named after pioneer Benoit Mandelbrot. The Mandelbrot set is generated by the iterative equation zn+1 = zn2 + c. This equation indicates that at a specific value of c, we get to the next z (that is, zn+1), by squaring our current z and adding the constant c. Let’s say that c is 1. z0 is 0, so z1 is z0 squared plus 1, and z1=1. Then z2=z12+1=2, z3=z22+1=5, and so forth. A value c is in the Mandelbrot set if zn→∞ goes to a constant value (so that zn=large is roughly equal to zn=large+1). When c=1, each z keeps getting bigger and bigger, so clearly it is not a part of the Mandelbrot set. c is a complex number, so we generate a map in two dimensions of which values of c belong to the set. The video below shows the Mandelbrot set (color giving rate of divergence, black giving a member of the set) and continues to zoom in. Even at incredible zoom scales, fine and self repeating structure can be seen.

Fractals can also be generated in a more directly visual way. Below is a fractal called the Koch Snowflake. The Koch Snowflake is generated iteratively as well. The base unit is a triangle. The middle third of each leg of the triangle is replaced by a tent. For the next step, the middle segment of all the legs of the new structure are replaced by a tent, and so on. You can see in the graphic that the Koch Snowflake gets complicated quickly. Many other visual fractals have been explored. The java applet here has a few that you can play with.

Koch snowflake from Wikipedia

I will have another post about fractals on Friday, where I discuss more numerical properties and examples of fractals in nature. Food for thought: what is the perimeter length of the Koch Snowflake? Also check out my previous science posts on synchrony and art resembling science.