Tag Archives: math

Fractals in Life: photos

Fractals are a branch of math that better describes nature. Before fractals, there was Euclidean geometry, the geometry of lines, planes, and spaces. Euclidean geometry cannot give the length of a rough coastline; neither can it give the surface area of shaggy tree bark. The answer you arrive at in Euclidean geometry depends upon the scale at which you examine an object– intuitively the distance an ant travels over rough terrain is different from the distance we cover walking. The ant interacts with the terrain at a different length scale than we do. Fractal geometry is designed to handle objects with multiple meaningful length scales.

Fractal objects are sometimes called “scale-free“. This means that the object looks roughly the same even if examined at very different zooms. Many natural objects look similar at multiple zooms. Below, I include a few. The craters on the moon are scale-free. If you keep zooming in, you could not tell the scale of the image.

frac (1)

Terrain is often scale-free in appearance– a few years ago there was a joke photo with a penny for scale. The owners of the photo subsequently revealed that the “penny” was actually 3 feet across. I couldn’t find the photo, but you cannot tell the difference. The reveal was startling. Below is a picture of Mount St Helens. The top of this mountain is five miles (3.2ish km) away. Streams carry silt away from the mountain, as you can see more towards the foreground. They look like tiny streams. These are full-sized rivers. Mount St. Helens lacks much of the vegetation and features we would usually use to determine scale. The result is amazingly disorienting, and demonstrates scale invariance.

SONY DSC

Plants are often scale free too. Small branches are very similar in appearance to large branches. Ferns look very fractal. Below is a picture of Huperzia phlegmaria. Each time this plant branches, there are exactly two branches. Along its length, it branches many times. It is a physical realization of a binary tree.

SONY DSC

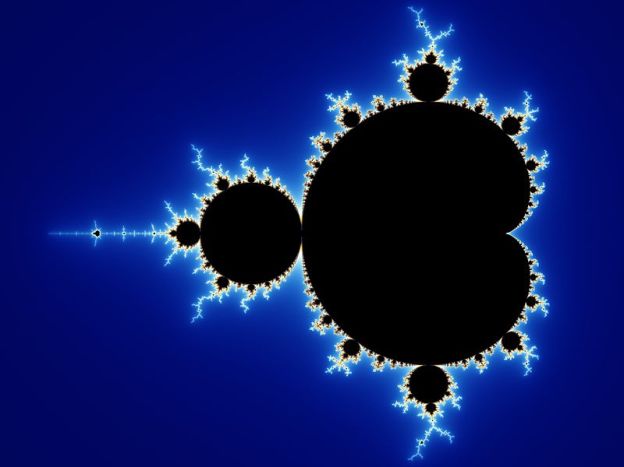
For more about fractals, read my posts about fractal measurement and the mandelbrot set.

Fun Science: Chaos

The common concept of chaos as the disordered unknown is a concept thousands of years old. Chaos as a branch of mathematics refers to an extremely ordered but complex behavior. In some lights, mathematical chaos might seem utterly random; different inspections reveal order. The first model of chaos emerged in the 1950s to model the movement of air in the atmosphere– the Lorenz model.

Defining Chaos in Mathematics

First, let’s discuss what chaos is in a mathematical sense (chaos on scholarpedia). In daily language, we would assume that something chaotic is not at all predictable. Chaos is deterministic, which means that if we know the position or value of a chaotic element exactly, then we know every value that it will ever have for all times. Many non chaotic systems are deterministic also; if we measure the position and velocity of a pendulum and its frictional loss, we can predict its path for all time.

If we are measuring some value, there is a limit to our possible accuracy. If you measure your weight, you are measuring your weight plus or minus some error associated with the instrument. We know some scales are more accurate, and some are less accurate. When we measure the position and velocity of the pendulum, there is some error, but the behavior at position x plus a little bit (or x+ε) is essentially identical to the behavior at position x. In a chaotic system, the paths following positions x+ε and x will be entirely different after some window of time. The paths will be similar for some window of time; the length of this window is determined by how chaotic the system is. This behavior is known as sensitive dependence upon initial conditions (or more famously, the butterfly effect).

The lower half of the image below shows the difference between two paths starting at x+ε and x in the Lorenz attractor. The paths are nearly the same, until they quickly become very different. You can look at the Lorenz attractor in more detail and play with it here. The link goes to a Java applet hosted by Caltech where you can change the parameters and see what happens in a time series and in a different representation called the state space.

The above image also shows the third of the three most common criteria for chaos: periodicity. This means that the system oscillates in some kind of way. The top half the picture above shows the time series of z variable (see link above for the full model if you are interested). If we plot the data in a different way, we get the image below. This image is called the Lorenz attractor. We see it loops around, but that it is bounded in space. That is, there are places we can say the path will not go. Intriguingly, the Lorenz attractor has a fractal dimension of 2.06. For more on fractals, you can read my posts on fractals and fractal dimensions.

Simple example of chaos: the double pendulum

Many pretty simple systems can exhibit chaos. The easiest example is the double pendulum, which is just a pendulum whose bottom is the top for a second pendulum.  The video below shows the complexity of behavior achieved by the double pendulum. Chaos has also been demonstrated in electrical circuits, biological systems, electrochemical reactions and planetary orbits. In another post, I will write about the amazingly universality of chaos, which shows how all of the diverse systems I listed are in fact very similar.

Fun Science: Fractals in Nature and Fractal Measurement

This post continues Wednesday’s post about fractals and the Mandelbrot set. Fractals are a branch of mathematics that we can observe in our daily life. Something is said to be fractal when a small piece of an object resembles a larger part of itself. The featured image is of romanesco broccoli; as you can see, each small cone on the broccoli resembles the overall structure of the vegetable. For this reason, the mathematical terms “fractal” and “self-similar” are closely related.

Examples of fractals in nature abound. The heartbeat of a healthy person is fractal when plotted in time; interestingly, people with various health problems show less fractal character to their heart rate. For a great slide show with images of fractal-ness in nature, check out this Wired article. Fractals have been observed in ocean waves, mountain structures, fern, lightning, city layout, seashell, trees, and many others. Many computer graphics of natural phenomena are generated using fractal processes.

Koch Snowflake (Wikipedia)

The Koch snowflake (above), is a fractal generated from a line. As the fractal pattern is repeated, the length of the curve grows infinite. A line segment does not have infinite length, and yet the Koch Snowflake clearly does not fill space. So what is the dimension of this object? Through a method called the “box counting method“, we can determine the dimensionality of a fractal object. The box counting method is used to estimate area and coastal length from satellite pictures, as demonstrated below.

Using the box counting method to estimate the area of Great Britain (Wikipedia).

In short, we can see how the number of boxes needed to define a length or space changes as the box size changes. For a line, the number of boxes needed grows as 1n. For a space, the number of boxes grows as 2n. The method is explained in more detail here. Intuitively, we can tell the Koch Snowflake has a dimension between 1 and 2. It turns out that, using the Box Counting method, we can determine that the Koch Snowflake has a fractal dimension of log(4)/log(3), or about 1.26.

Lorenz attractor from Wikipedia

Fractal dimensions turn up in strange places. For example, chaotic attractors have fractal dimension. The Lorenz attractor, above, has a fractal dimension of 2.06. In the future I will discuss chaos and chaotic attractors. Check out my previous science posts on synchrony and art resembling science.

Fun Science: Fractals and the Mandelbrot Set

Fractals are often immediately visually appealing, even if the underlying equation is harder to understand. For this reason, fractals have reached a wider audience than many branches of mathematics. Beyond their visual appeal, fractals give us a way to look at many natural systems that math was not previously able to examine. How long is a winding and convoluted coastline? How does a one-dimensional system like the circulatory system serve our three-dimensional bodies? How does lightning disburse its energy when it strikes? (The image below shows how electricity dissipated through a block of plexiglass, more details here.) These are all concepts related to fractals.

from Capturedlightning.com

One very famous fractal is the Mandelbrot set (pictured at the top of this entry), named after pioneer Benoit Mandelbrot. The Mandelbrot set is generated by the iterative equation zn+1 = zn2 + c. This equation indicates that at a specific value of c, we get to the next z (that is, zn+1), by squaring our current z and adding the constant c. Let’s say that c is 1. z0 is 0, so z1 is z0 squared plus 1, and z1=1. Then z2=z12+1=2, z3=z22+1=5, and so forth. A value c is in the Mandelbrot set if zn→∞ goes to a constant value (so that zn=large is roughly equal to zn=large+1). When c=1, each z keeps getting bigger and bigger, so clearly it is not a part of the Mandelbrot set. c is a complex number, so we generate a map in two dimensions of which values of c belong to the set. The video below shows the Mandelbrot set (color giving rate of divergence, black giving a member of the set) and continues to zoom in. Even at incredible zoom scales, fine and self repeating structure can be seen.

Fractals can also be generated in a more directly visual way. Below is a fractal called the Koch Snowflake. The Koch Snowflake is generated iteratively as well. The base unit is a triangle. The middle third of each leg of the triangle is replaced by a tent. For the next step, the middle segment of all the legs of the new structure are replaced by a tent, and so on. You can see in the graphic that the Koch Snowflake gets complicated quickly. Many other visual fractals have been explored. The java applet here has a few that you can play with.

Koch snowflake from Wikipedia

I will have another post about fractals on Friday, where I discuss more numerical properties and examples of fractals in nature. Food for thought: what is the perimeter length of the Koch Snowflake? Also check out my previous science posts on synchrony and art resembling science.

Fun Science: Art Resembling Science

Can you tell the two below pictures apart? Which of the following two images is a modern aboriginal painting, and which is a picture of an oscillatory chemical reaction?


The left image is of the Belousov-Zhabotinsky (BZ) chemical reaction. The right image is a painting from Western Australia using aboriginal techniques. They are strikingly similar. Could it just be a coincidence? I believe some models with bacteria growing competitively yield similar patterns; perhaps such patterns existed in nature. (EDIT: traveling wavefronts like above have been shown in slime molds. A search on “cAMP spiral waves” reveals many examples.)

Art: Aboriginal designs from Western Australia

The image on the right above came from a book about Aboriginal art called Balgo-4-04 that I found at the Kluge-Ruhe Aboriginal collection in Charlottesville, VA. Unfortunately, I did not think to write down the title of the exact work, or its info (hopefully I will go back soon and retrieve it).

The collection was put together by Warlayirti artists from Western Australia. I don’t know the year of this painting, but I think it is modern and based upon older sand painting techniques. Unfortunately I am not enough of an expert on this topic to provide any deep insights. If anyone else is, I’d love to learn more.

Science: Belousov-Zhabotinsky reaction

The image on the left is an image of the Belousov-Zhabotinsky (BZ) reaction (photo credit: Brandeis U Chemistry). For a more technical overview, check out the Scholarpedia page. Transition metals at different oxidation states lead to these colors; the particular metal can be varied to give different properties. Cerium and manganese, as well as many others, can be used in the reaction. The curling waves in the dish are traveling oscillations. The video below shows the patterns in time.

Another good youtube video showing how the BZ reaction is set up is here. The behaviors observed in the BZ reaction occur in other oscillatory systems. The spiral waves are 2D analogies to the 3D scroll waves that occur in the heart during ventricular fibrillation (VF). VF causes the heart to quiver and is deadly. In this link, wave-propagation in the heart is shown under several conditions (using a java plug-in). If you click “java applets” on the left, under the “introduction” header, you can choose VF, VT (ventricular tachycardia), and normal heart rhythm. You can then apply defibrillation to these rhythms and see what happens. The website is maintained by a scientist, Flavio Fenton, who researches nonlinear dynamics in hearts and biological systems.

For more discussion on oscillatory dynamics, check out my post on synchrony.

Fun Science: Synchrony

Have you ever wondered why fireflies flash at the same time ? Or how the heart contracts and relaxes? Why they had to shut down the Millennium Bridge in London for repairs? These are all questions related to synchrony. (See the following papers about these questions if you are interested in the mathematics: J Buck, 1988, Quar Rev Biol; Strogatz, 2000, Physica D; Strogatz et al, 2005, Nature; Michaels et al, 1987, Circulation Res.)

By synchrony, I am talking about the tendency of systems that periodically do something to align into patterns. This periodic action could be contracting (heart cells), chirping (crickets), firing (neurons), stepping (people walking), swinging (pendulums)… you get the idea. Synchrony can apply to the simplest or the most complicated interacting items, from transistors to crickets and neurons and people. The study requires only some kind of repetitive action.

How do all these systems synchronize? The elements communicate in some way. At a concert, thousands of people can clap together at the same beat because they hear each other. In the example below, 32 metronomes synchronize because the table is not fully rigid. Each metronome is slightly disturbed by the shaking in the table, and is slightly changed by it. As a dominant timing emerges, the metronomes synchronize. And each metronome retains its natural character– no oscillators stop or become greatly faster to achieve synchrony.

Synchrony isn’t always desirable. When the Millennium Bridge was opened, it was a new kind of bridge design. As thousands of people crossed it, it began to sway from side to side. Due to the slight swaying, people trying to maintain their balance began stepping with this rhythm, adding energy to this rhythm. This continued to the point where the bridge swung visibly. It was shut down, and dampening was added. The Millennium Bridge was similar to the famous Tacoma Narrows bridge, except that thousands of people had to act in unison to activate the resonant frequency. Synchrony is also believed to play a role in epilepsy. The theory is that a strong synchronous signal emerges, and this signal overwhelms the normal functions in the brain. So when we study synchrony, we wish to understand how it arises, and sometimes how to destroy it.

I study synchrony in electrochemical oscillators. Drop me a note or a comment if you have questions or thoughts.

Some more cool videos:

And a topic for future discussion, chaos

  • Chaotic double pendulum– amazingly, something as simple as a pendulum with two vertices exhibits some wild and chaotic behavior.